A dashboard that surfaces the three numbers that matter
Real-time charts over your real data — not forty vanity metrics nobody checks.
50% on kickoff, 50% on delivery · 30 days of free revisions · you own the code
Recent work
See all →
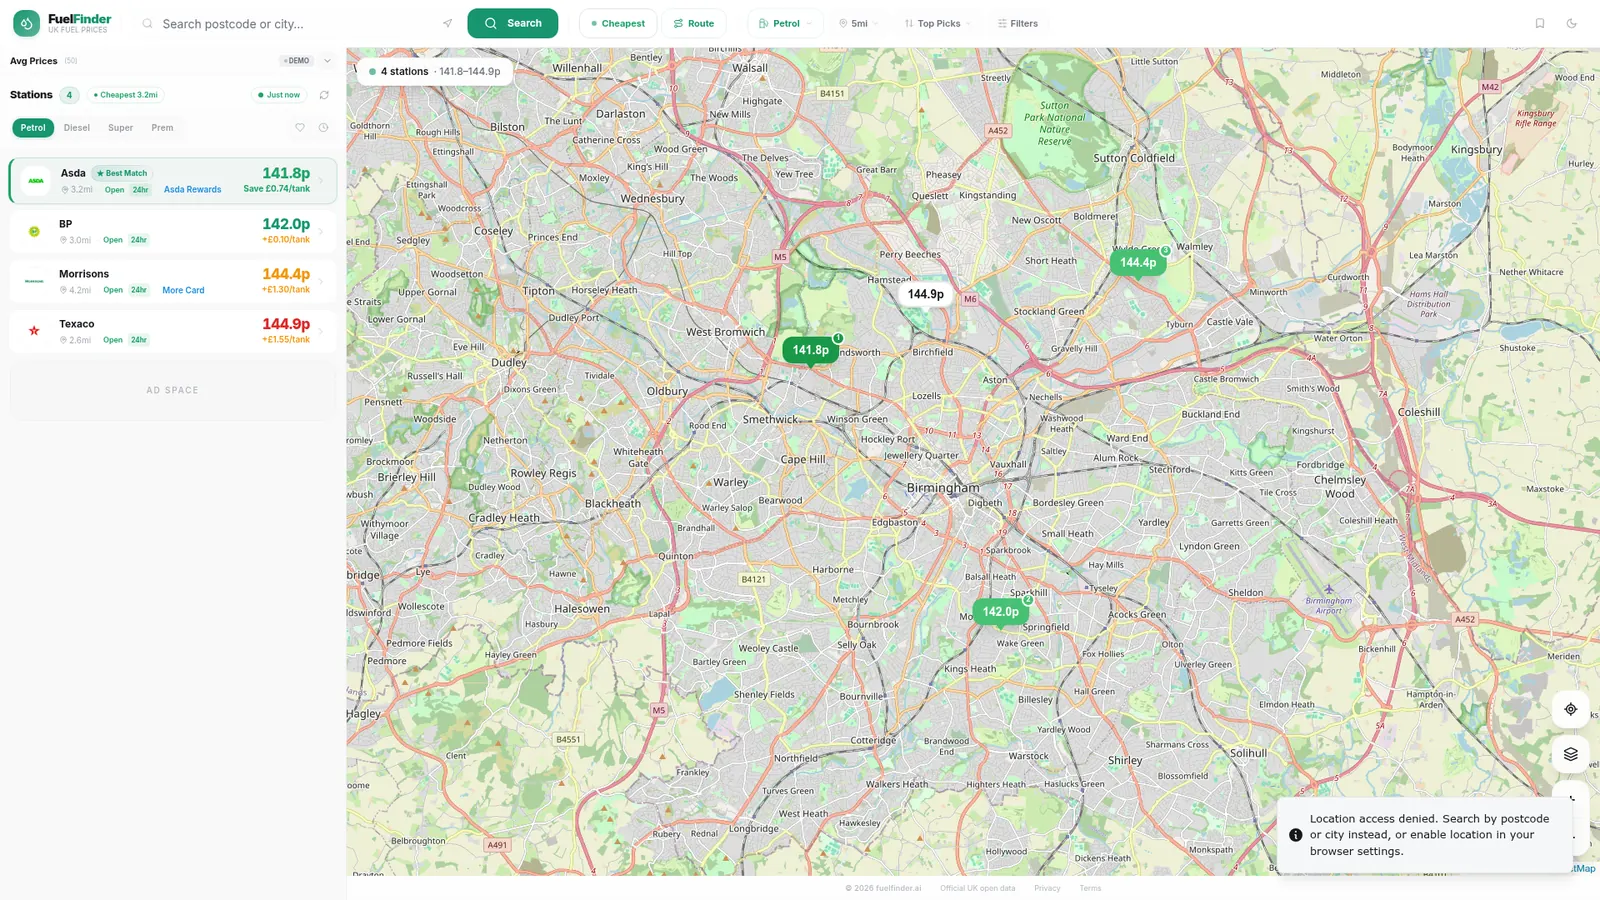

Why we wrote this. We ship work like this ourselves — not as a reseller or a marketplace. The timelines, deliverables, and price bands below come from real engagements we've run end-to-end at Smartly Built Ventures Limited (trading as Vibed Ventures).
Who this is for
- Founders staring at Stripe + GA4 + a Sheet every morning
- Ops and finance teams asked to 'just pull a number' weekly
- Anyone whose Looker / Metabase setup nobody opens
What you get
- Three to seven core charts agreed up-front (no kitchen sink)
- Live queries against Postgres, BigQuery, Snowflake, or your API
- Email/Slack alerts when a metric crosses a threshold
- CSV export and shareable read-only links
Dig deeper
Frequently asked
Can it read from our warehouse?
Yes — BigQuery, Snowflake, Redshift, Postgres, MySQL. If it speaks SQL, we can query it.
Will it stay fast as data grows?
We add materialised views or a small cache layer when raw queries get past a few seconds. Built into the price.
What happens next
- Step 1Tell us the problem60 seconds in the /solve box. You don't need a brief.
- Step 2Get a tailored reportROI, build plan and a rough price band — emailed to you.
- Step 3Book a 25-min callWe talk it through honestly. If it's not for us, we'll say so.
Related in build
- Build an MVP in two weeksA real, paid-account-ready product in 14 days — not a Figma file.
- Build a SaaS, end to endAuth, billing, dashboard, admin — everything a paying customer expects, shipped in weeks.
- Build an internal toolCulled — 301s to /internal-tools.
- A marketing site built to rank, not just look goodReal SSR, real metadata, real schema — built by the team behind the live projects on this site.